A Silicon Alley Insider graphic recently making its way around the Twittersphere caught my attention and deserves a mention.
It’s a really simple depiction that in my opinion helps further disprove the Myth of the $100M Revenue Milestone I’ve already discussed. Recall that the $100M Revenue Myth is the oft-quoted maxim that companies need to be on a $100M revenue run rate and be profitable for at least two quarters before going public.
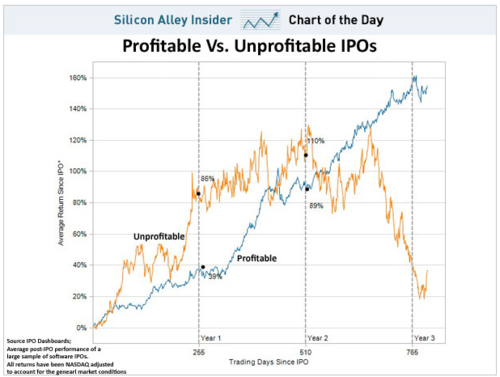
This chart shows clearly that unprofitable IPOs have actually outperformed profitable IPOs through the first two years of being public.
How can this be?
From what I’ve seen, unprofitable companies that have successful IPOs typically capture investor interest based on rapid growth rates and perceived large market opportunities. Recall that “Underlying Growth & Market Size” is one of the Fab Four. Although this chart doesn’t incorporate growth rate as an additional dimension, I’d be willing to bet that growth rate correlates much more closely with stock price performance post-IPO.
Interestingly, the unprofitable curve plummets between 2 and 3 years post IPO. At some point, investor patience will run out. Ultimately, public investors expect profits. Fast growth in a large market is great, but eventually you’ve got to deliver earnings as a public company. How long do you have? This chart makes a good case for 2 years.
Dan Primack also tackled this issue recently,noting that in 2011, profitable venture backed IPOs have performed better than unprofitable ones.
So, the data is mixed. But, the bell has sounded clearly – unprofitable companies can have successful IPOs.